Hi could anyone explain this graph to me? Thanks in advance ya 
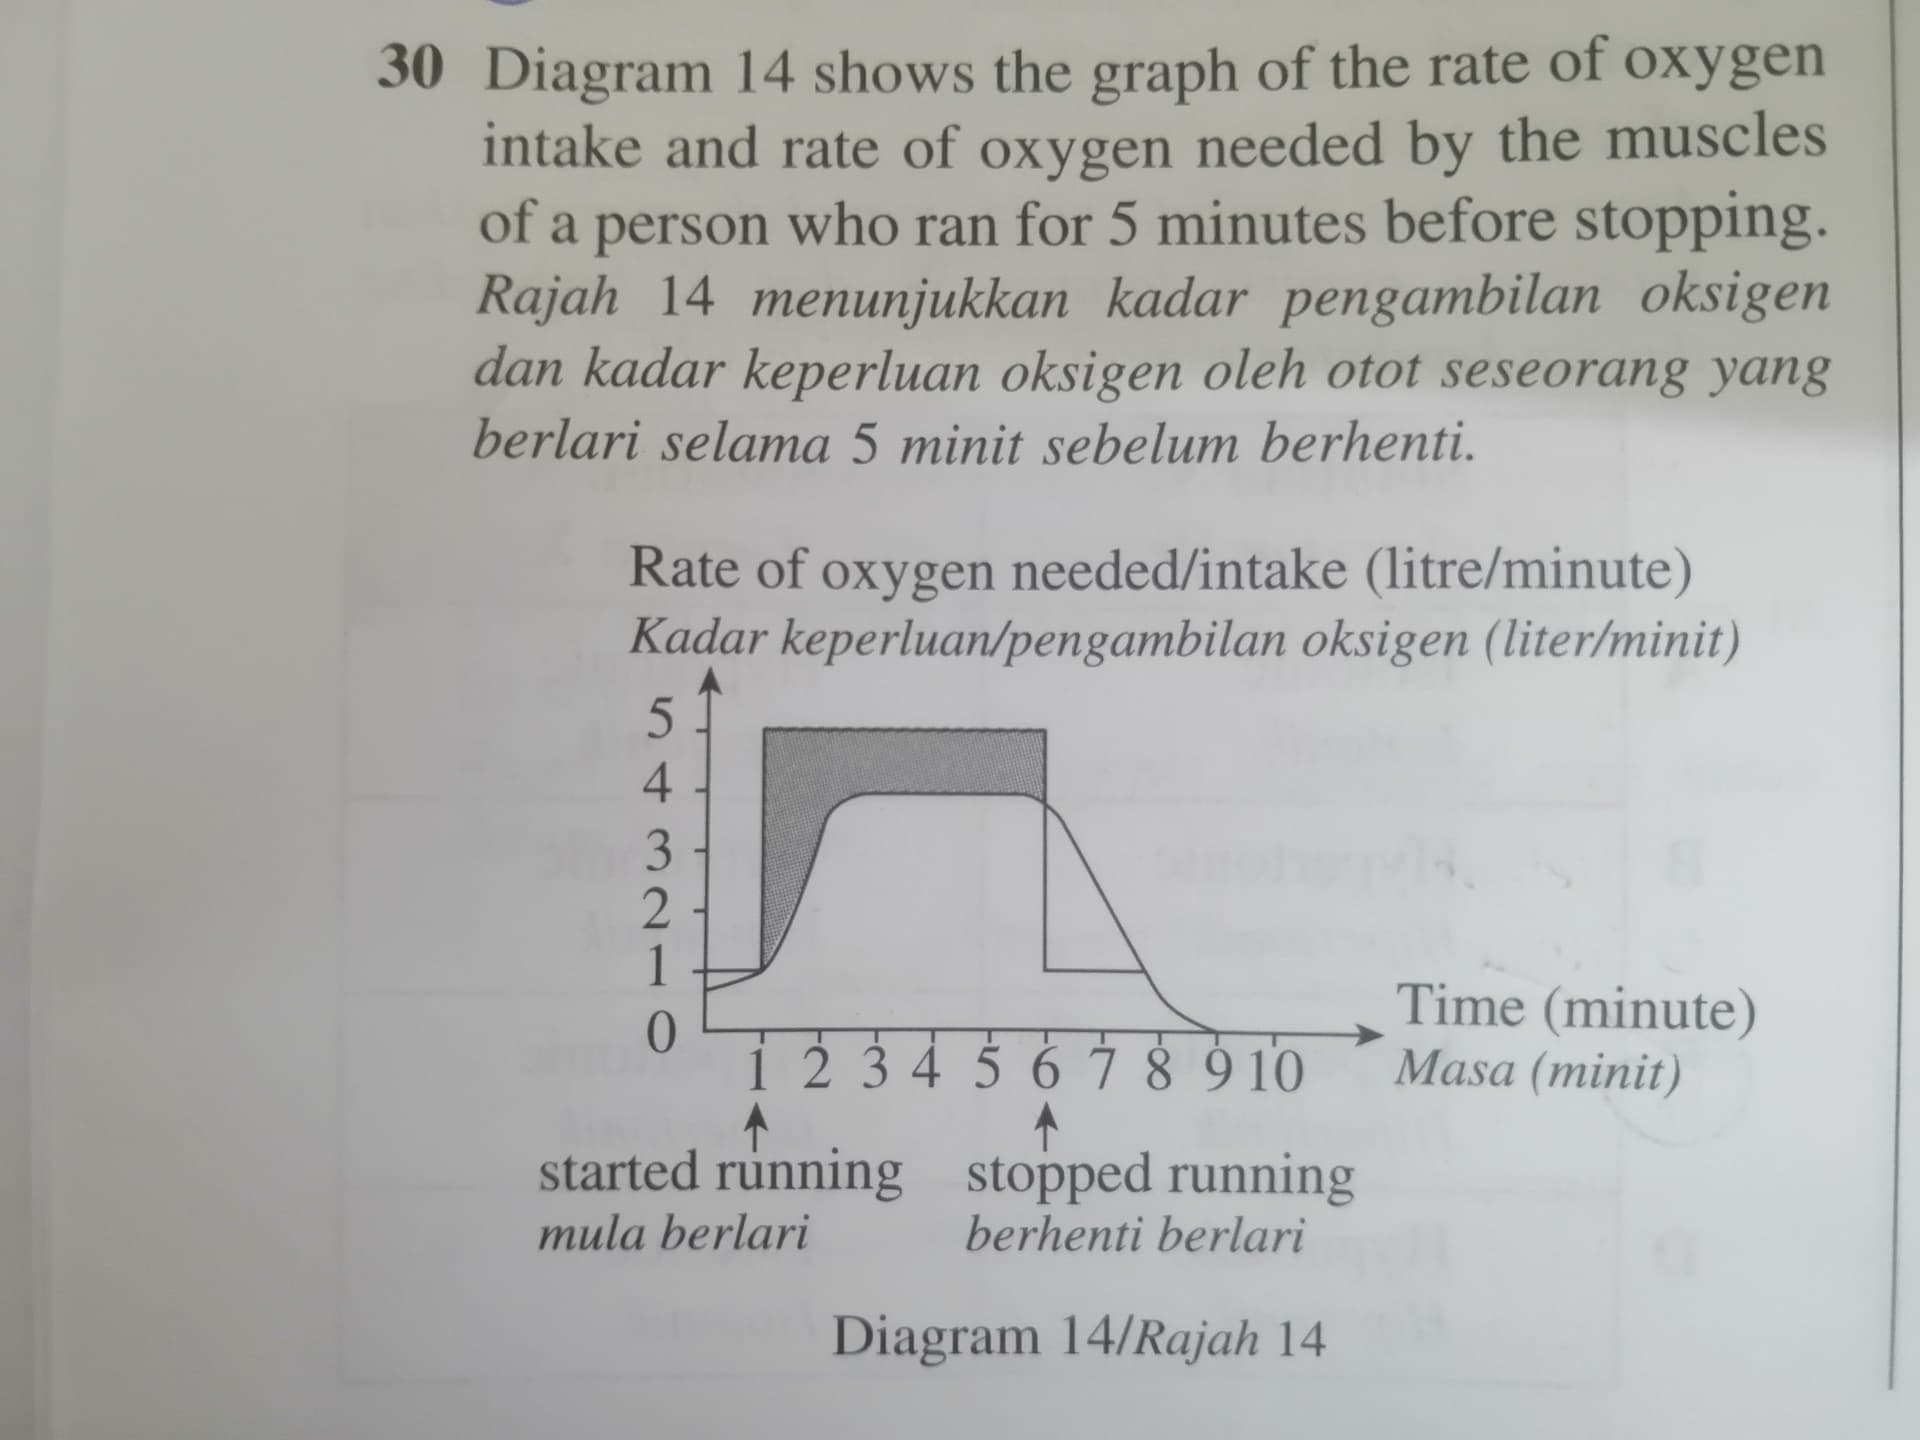
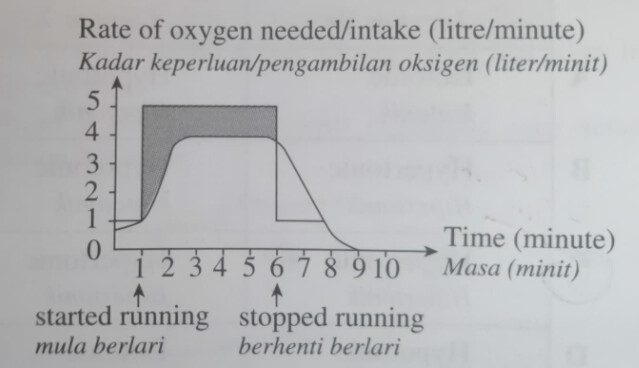
Q30 Diagram 14 shows the graph of the rate of oxygen intake and rate of oxygen needed by the muscles of a person who ran for 5 minutes before stopping. Rajah 14 menunjukkan kadar pengambilan oksigen dan kadar keperluan oksigen oleh otot seseorang yang berlari selama 5 minit sebelum berhenti.
Diagram 14/Rajah 14
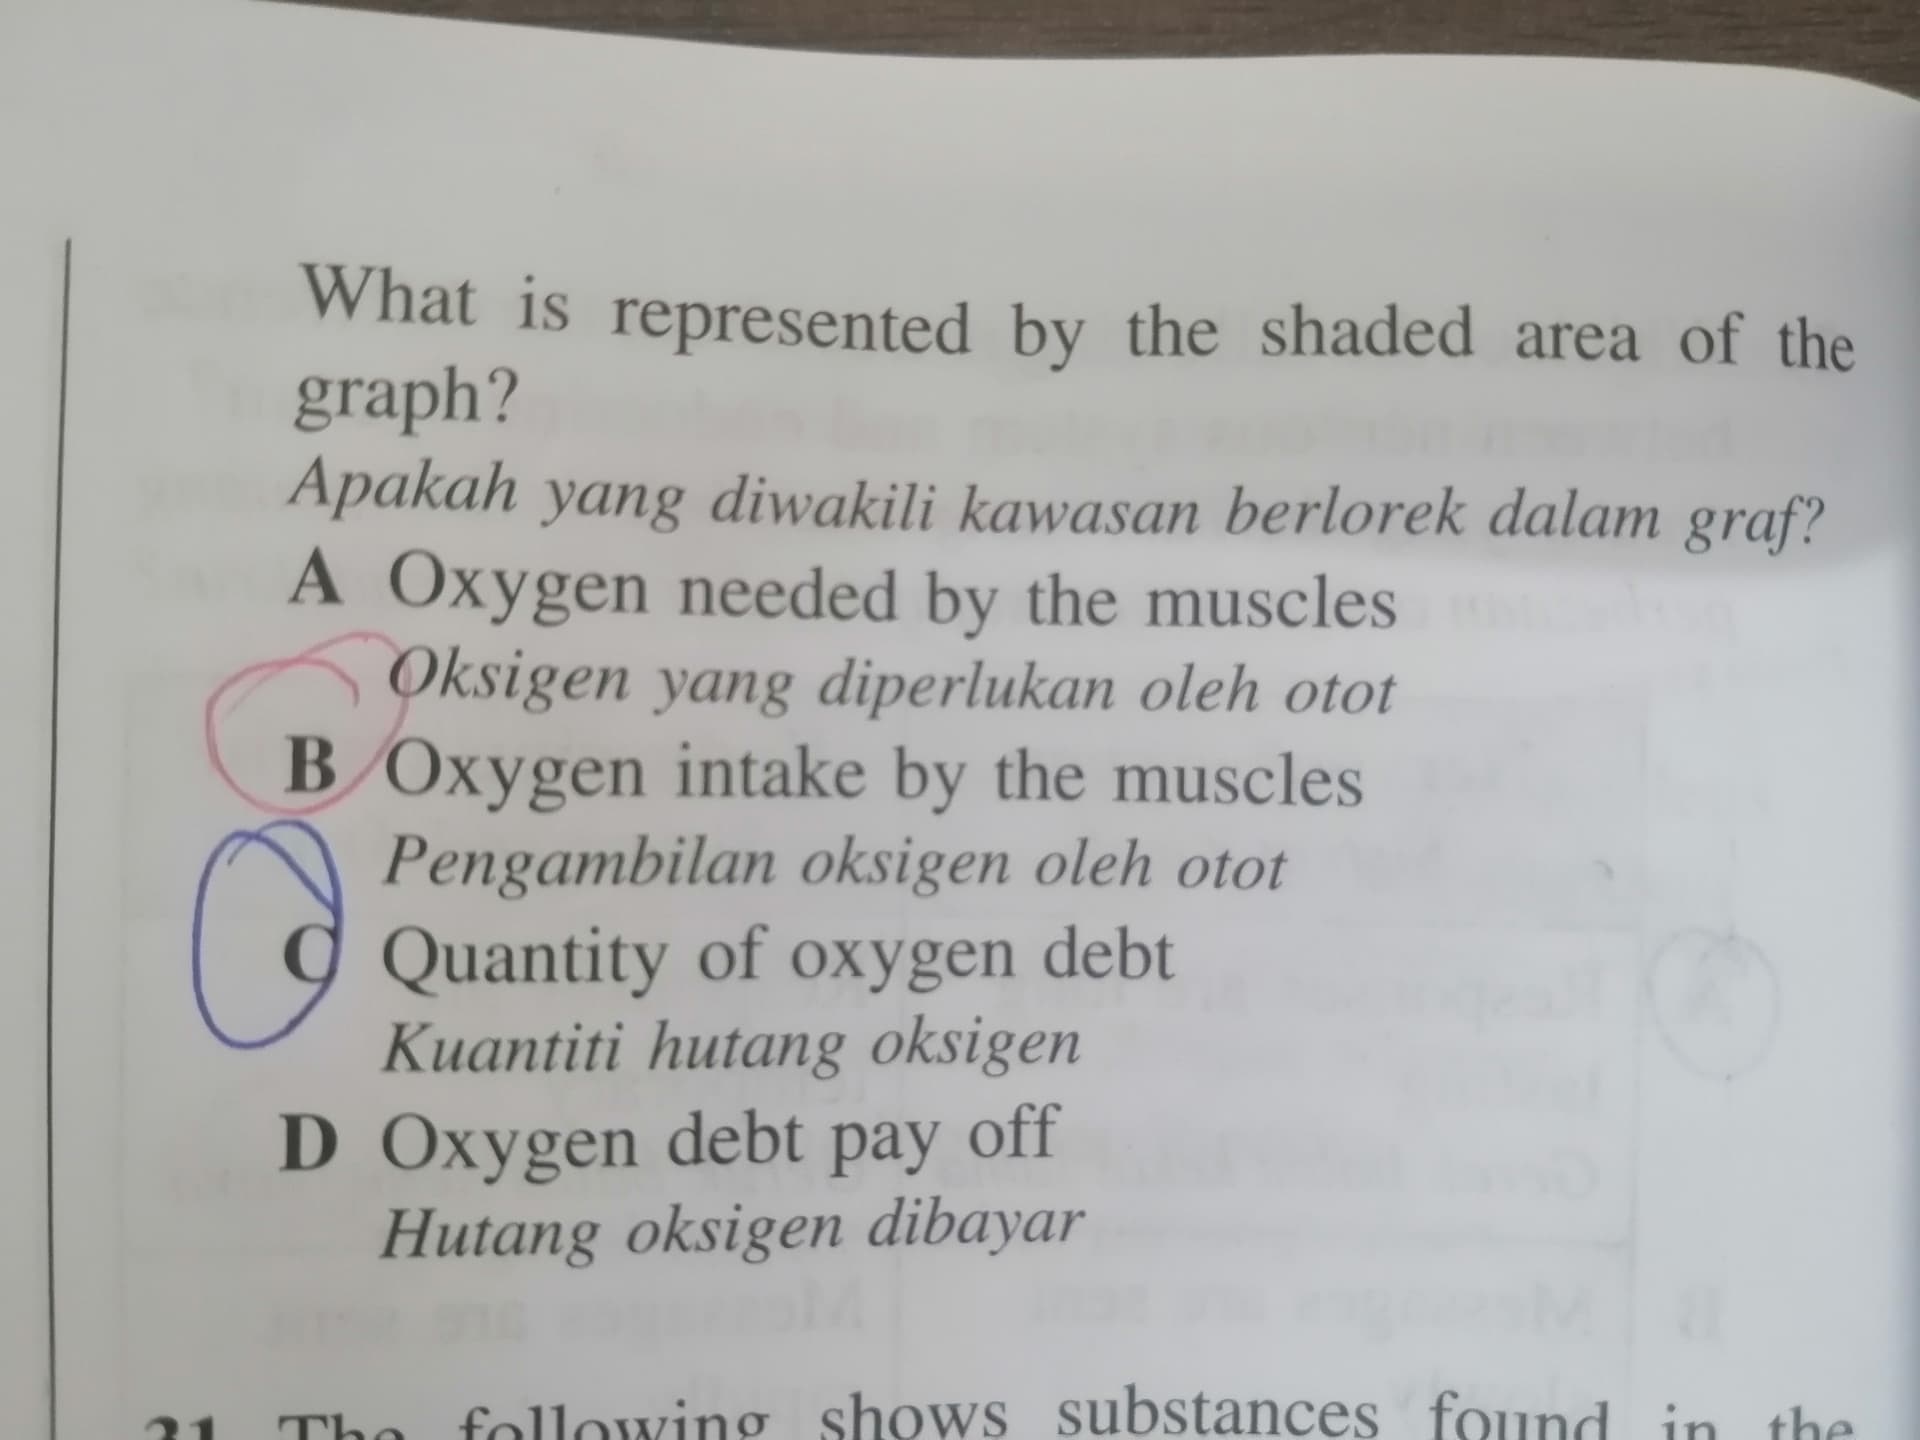
What is represented by the shaded area of the graph?
Apakah yang diwakili kawasan berlorek dalam graf?
A Oxygen needed by the muscles
Oksigen yang diperlukan oleh otot
B Oxygen intake by the muscles
Pengambilan oksigen oleh otot
C Quantity of oxygen debt
Kuantiti hutang oksigen
D Oxygen debt pay off
Hutang oksigen dibayar
-
The area under the square portion of graph represents “oxygen needed by the muscles”, which is at a constant rate (5 L/min) if the muscles are working at the same “rate”.
-
The area under the curve portion of graph represents the “oxygen intake achieved by lungs”, which hits a maximum of ~4 L/min at max. breathing capacity.
Refer to the graph below:
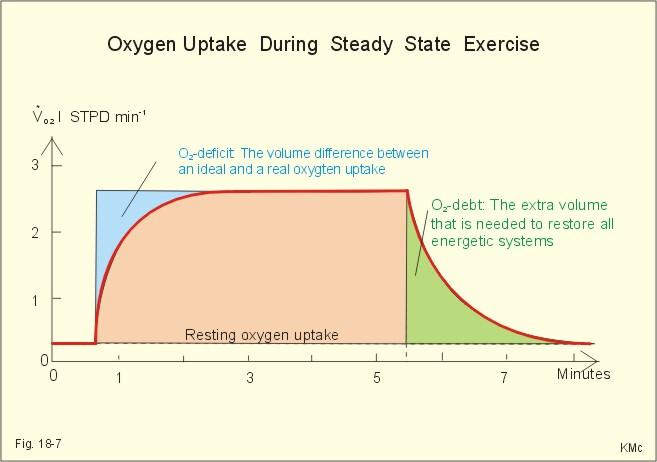
In short, “Oxygen debt” is the overall debt accumulated during exercise that has to be replenished after the physical activity, whereas “oxygen deficit” is the dynamic negative effect of not providing the body’s requested amount of oxygen during exercise that accumulates the overall oxygen debt.
Since the shaded area in Q.30 is before the end of activity, it cannot be C. Quantity of oxygen debt. A. Oxygen needed by the muscles is the area under the square portion.
The correct answer should be Oxygen deficit, but in the context of this question, it is treated as “additional oxygen intake that is required by the muscles”, since the supply (curved part) is lesser than the requirement (square part).
B. is in fact the area under the curved portion, and isn’t that suitable as the answer.
So, there is a problem with the phrasing of answer.
2 Likes