Question
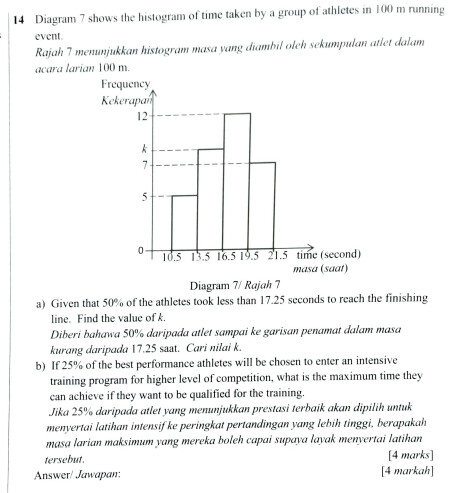
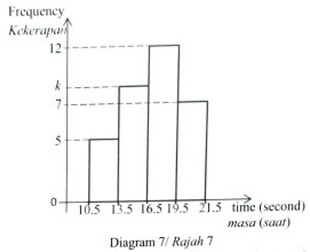
Diagram 7 shows the histogram of time taken by a group of athletes in 100m running event.
Rajah 7 menunjukkan histogram masa yang diambil oleh sekumpulan atlet dalam acara larian 100m.
a) Given that 50% of the atheletes took less than 17.25seconds to reach the finishing line, find the value of k.
Diberi bahawa 50% daripada atlet sampai ke garisan penamat dalam masa kurang daripada 17.25 saat. Cari nilai k.
b) If 25% of the best performance athletes will be chosen to enter an intensive training program for higher level of competition, what is the maximum time they can achieve if they want to be qualified for the training.
Jika 25% daripada atlet yang menunjukkan prestasi terbaik akan dipilih untuk menyertai latihan intensif ke peringkat pertandingan lebih tinggi, berapakah masa larian maksimum yang mereka boleh capai supaya layak menyertai latihan tersebut. [4 marks / 4 markah]
Answer
Hi Bernard,
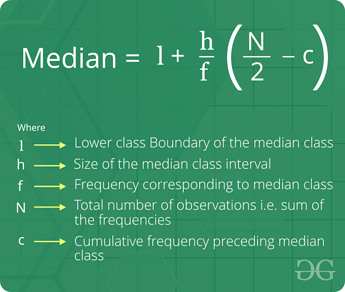
This question is based off KBSM syllabus, we use the following formula for grouped data (data grouped into class intervals)
I’m guessing for KSSM syllabus they already removed the formula because I skimmed through the textbooks but couldn’t find it. Feel free to read it or just skip to the other method below haha 
Old SPM method
From the question, it is given that 17.25 is the median and so 16.5-19.5 is the median class. Why is 17.25 seconds the median? More on that later.
Therefore we just substitute the values:
l=16.5
h=3
f=12
N=5+k+12+7=24+k
c=5+k (preceding means before, cumulative frequency before the median class)
17.25=16.5 + \frac{3}{12}[\frac{24+k}{2}-(5+k)]
3=7-\frac{k}{2}
\frac{k}{2}=4
k=8
note:
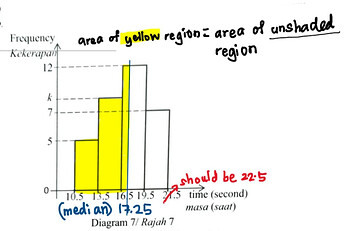
I realized that there is a typing error for the last upper-class boundary because the formula would not work if the class sizes are not equal.
It should be 22.5 instead of 21.5. (old SPM would never ask histogram of unequal width haha, if not the y-axis would be frequency density, more on that if you study Pre-U level maths  )
)
But there is also another way we could solve this, using the area under the histogram method. Taking the total area of the histogram (sum of areas of all the rectangles) as a probability of 1.
(something like your normal distribution curve)
Why is 17.25 the median?
If you draw a vertical line that passes through the median on the histogram, it will divide the histogram into two equal areas, which means you have a 0.5 probability of finding a value lower than the median value and a 0.5 probability of finding a value higher than the median value.
Note that the question said given 50% of athletes took less than 17.25 seconds, they are referring to the yellow region in the diagram. If it wasn’t 50%, then 17.25 isn’t the median.
I hope this diagram helps you to visualize it better :))
Method 1 (recommended)
Taking the ratio of the yellow shaded area to the total area of histogram:
\frac{(13.5-10.5)(5)+(16.5-13.5)(k)+(17.25-16.5)(12)}{(13.5-10.5)(5) + (16.5-13.5)(k) + (19.5-16.5)(12) + (22.5-19.5)(7)} = 0.5
\frac{24+3k}{72+3k} = 0.5
24+3k=36+1.5k
1.5k=12
k=8
Method 2 (answer-checking purposes)
It works if you take the ratio of the unshaded area to the total area of the histogram too since they are equivalent! 
\frac{(19.5-17.25)(12)+(22.5-19.5)(7)}{(13.5-10.5)(5) + (16.5-13.5)(k) + (19.5-16.5)(12) + (22.5-19.5)(7)} = 0.5
\frac{48}{72+3k}=0.5
48=36+1.5k
12=1.5k
k=8
Method 3 (answer-checking purposes)
Or you can even use area of yellow region=area of unshaded region, but best for the purpose of checking answers only. I would still recommend the first method as it is the most direct approach.
(13.5-10.5)(5)+(16.5-13.5)(k)+(17.25-16.5)(12)=(19.5-17.25)(12)+(22.5-19.5)(7)
24+3k=48
3k=24
k=8
Hope this helps! 


